


In this second of a 2-part series, we will describe how we went about building the flowchart tool and what inherent challenges were confronted in the process.
If you have missed Part 1 you can read it here.
How we went about it
We broke down the functional units of the application as follows:
- The toolset to manipulate the drawing canvas and to introduce shapes onto it.
- The canvas – where shapes and connectors would be manipulated.
- And finally, host composition and interaction, using which, the charting data would be loaded/saved.
These units were functionally isolated to the extent that they could be built independently and not in any specific order, provided we had our interfaces mapped out from the start.
The toolset would be managed by its own set of MVVM objects and so would the canvas. Where the 2 intersected and the canvas needed to know about choices exercised on the toolset, the canvas would subscribe to a host of toolset events which would be broadcast whenever the underlying toolset model changed in a typical subscriber/broadcaster pattern.
The host interaction was worked as a service layer with the service at the backend being exposed as .NET WCF Data Contract classes which the client invoked via XHR requests.
The toolset
As with any conventional UI-based system, the toolset was designed to be visually at the top of the application positioned statically.
Since this was a graphing tool, with vector graphics being at the core of the application, we stayed away from using bitmaps and instead opted to draw the toolset GUI using SVG. Fig. 2 illustrates a part of the UI.
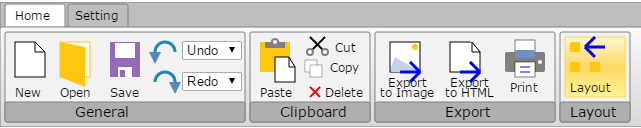
Fig. 2
Although the SVG elements were constructed by hand, these could be built using any appropriate vector-based drawing tools like Adobe Illustrator© that exports to SVG.
It is worth mentioning here that with the advent of HTML5 support in modern browsers, the native support for SVG has vastly improved to the point that most common browsers (IE, Firefox, Chrome and Safari) render the markup predictably and consistently with few minor tweaks if any.
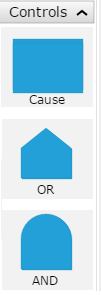
Fig. 3
The side toolbar used for the introduction of shapes onto the canvas was built similarly (See Fig. 3).
Both toolbars were organised as a pair of Backbone© js view/model classes with event sinks that updated their respective models. The views themselves were described as markup in separate files that were loaded into the main dom as templates using Backbone’s© template infrastructure (which piggy banks on the underlying underscore©js library as a dependency).
Changes to the model would be emitted as change events for objects interested in subscribing to the model state changes.
Additionally, for actions that did not require a model update (for e.g., the copy-paste functionality), appropriate events were broadcast for other subscribers to consume.
The canvas
The canvas is where the shapes would be defined and their connectors established (Fig. 4).
Potentially, an unlimited number of CAUSE shapes could be added to the canvas connected by AND/OR shapes based on a predefined set of business rules.
Shapes and their connectors could be repositioned, annotated with text and decorated with colours or otherwise have their location and orientation transformed. Connectors could be deleted and redrawn to build up a graph as required.
In our approach, we took the route of using twin HTML canvas elements, one for a static background which would be used to colourise the canvas, draw a grid with snap-to features and a foreground canvas (obviously layered above the background) that composited the shapes and their connectors.
HTML lets you layer as many canvas elements as necessary and this separation meant that we could persist and manipulate the background separately from the foreground. The flip side was that we’d have to manage 2 canvas elements when zooming.
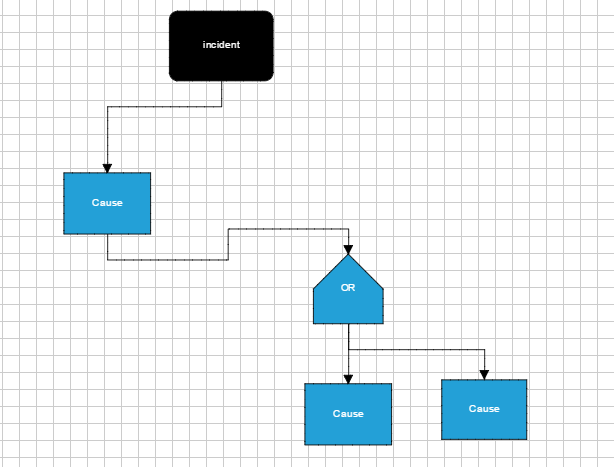
Fig. 4
The canvas would go on to support colouring, grid display with cell size and colour customisation, a snap to grid feature for shapes, zooming with a fit-to-window feature and panning.
Each discrete feature was built as a separate javascript object with the canvas instance calling into the services of these objects as necessary.
So, for instance, a toolset click of the zoom button would trigger a zoom event with the event object (passed in as a parameter to the callback) detailing the amount of zoom. The canvas object would be set up to listen for this event and in-turn request the services of the panzoom object to play out the zoom.
All service objects would function as mixins on their primary objects, offering a set of core reusable functionality.
The primary objects were the 3 views, the top, side and the canvas center. These views would sync up with their models using the Backbone© js infrastructure. Each view would then provide events that other views could subscribe to as necessary.
Some objects were deliberately kept global so that they could be instantiated once and reused often. All javascript objects would be scoped to one principle javascript object, which in our case, was called the app object.
This app object would be instantiated once at the beginning of the application along with the 3 views – scoped to the app object. This was done to avoid polluting the global window namespace.
Host interaction
The cause mapping tool required a fair amount of integration into the host application.
Aside of being called from a specific piece of functionality within the host, the individual cause elements were required to carry metadata and record details of actions taken to mitigate/eliminate the cause. Additionally, each cause element could have one or more image assets attached to them.
This was achieved using a single host interface javascript object whose sole job was to make XHR calls using jquery’s ajax api and return results from the host as appropriate. Returned results were then raised as a success (or failure) event for the consumer of the service.
Typically, the host interface object would serve as a mixin for another client object that made the request. This client would register itself as a listener on the outcome of such a host request, which would then return a result asynchronously.
Each service request was a method, both, on the client’s host Interface object and the service layer defined on the server. The calls were set up to exchange json payloads.
A typical interaction with the host would involve saving/loading the canvas state. Additional interactions involved fetching/persisting individual cause element metadata.
Challenges
Challenges set the scene for new learning and it’s what keeps the adrenaline pumping.
Since this was a one of a kind project for us, we had our share of stumbling blocks to overcome but none of which could be showstoppers if we applied our minds to it and worked with some help from the support community
So here is the list of what we would deem to be the more interesting bits to build into the application.
- Undos/Redos
The application was required to support a fair amount of actions to step back into or move forward from. These actions would be restricted to interactions on the canvas. For e.g., if a shape was moved or rotated, a connector added or deleted, these would record themselves as actions for rewind/replay.
There were 2 approaches to consider:
- Record the last state of an object before transformation and use that for undos.
Fabric© js implicitly records the last state of an object internally and this can be accessed through the object api.
- Store a snapshot of the entire canvas as a json string and use this to replay actions. Again, Fabric© js lets us record the state of the entire canvas as a single json object.
Each option would use the mechanism of a stack for each of the 2 actions, undo and redo. There would be a stack for undo onto which would be pushed the latest action and a corresponding redo stack that received the last undo action from the top of the undo stack.
If a bunch of actions were simultaneously undone, then all such actions from the earliest selected to the latest would be plucked out of the undo stack and pushed over to the redo stack in the exact same order.
We went along with the second option because it was expedient to do so, primarily for the simplicity of recording the modifications as a single unit, but also for the fact that we restricted the replay actions to 20, meaning we weren’t storing too much data in memory at any given instance.
- Binding connectors to shapes
Fabric© js does not have any built-in functionality to bind connector lines to shapes. We’d have to write our own code to do this. What this meant was that we’d have to design a way by which each connector could store information about the shape it originated from and the shape it terminated on.
This was not too difficult to achieve once we realised that Fabric© js lets us annotate custom information as regular javascript object fields onto shapes (connectors are shapes too, they are lines which inherit their basic characteristics from shapes).
All that was required was to build a couple of fields on each connector and populate them with an identifier for its 2 shapes. For shape identification, we used the javascript datetime object represented as an integer to give us a unique number in time.
The other interesting bit was to ensure the connector ends follow their respective shapes as they are translated/rotated. Translated shape locations are trivial to manage, just redraw the connector end on the side of the translated shape using the shape’s new location.
What was tricky to do, was to ensure the connector ends stay connected when the shapes are rotated, since a rotated shape has its co-od geometry rotated. This meant using a small amount of rotational geometric computation to find the points to connect to in the rotated space (Point 1 moves to point 2 in the Fig. below) – hint: use the javascript Math object’s sin and cos functions to arrive at the projections of the rotated point.

- Connector heads to follow connectors
The line connector heads are again not a built-in feature of Fabric©© js. One would need to build the heads as geometric shapes and then group them with their connectors so that they translate as a single unit.
The tricky bit, was again, the rotation of the connector head to follow the rotation of its connector line and to ensure that the “tip” of the head was always above the top of the shape it was connected too, even when the shape was rotated. We didn’t want the connector head to be buried behind the shape when it was rotated or scaled.
All of this meant we’d have to hook into the translation events of the shapes that the connectors were bound to and manipulate the connector ends to ensure the objective was achieved at all times.
- Fit-to-Window
How do you fit the entire graph into the visible viewport of the application’s on-screen
real estate without having to scroll through the canvas? That’s what Fit-to-Window is all about.
Well to spell it out, here’s the approach we took:
Incrementally zoom out the canvas in discrete steps – the smaller the better (we used steps of 5 zoom units) but not too small since it’s an iterative process, and in each step, iterate over all shapes on the canvas to find shapes whose bounds exceed the bounds of the zoomed out canvas. If you find such shapes, continue the iteration until all shapes fall within the canvas bounds or you zoom out completely (an awkward proposition!).
- Auto layout of the diagram
A diagram can grow unwieldy over time with shapes spread out all over the canvas.
It would be nice if the entire chart could be drawn vertically, narrowing the space between shapes and driving through a uniform horizontal and vertical breathing space. This is exactly what this feature would accomplish.
To this end, the simple algorithm we came up with was:
- Iterate over all shapes starting from the first and using the unique shape identifier we described earlier (unique in time), walk through the graph, stacking up shapes vertically at a fixed gap interval and redraw the connectors between the relocated shapes.
- Shapes that connected back to a single parent, meant that they would additionally need to be stacked horizontally under the parent following each other at a fixed horizontal distance.
Concise and effective!
Hopefully this blogging proved useful reading.